WTF just happened!? Tesla Q3 earnings explained in 7 SIMPLE charts 📈📈
This short-article explains the REAL reason Tesla is going to become the "WORLD MOST VALUABLE COMPANY" in a few years according to Elon Musk.....
Supply chains, Inflation and desperation.
Despite all of the challenges facing Tesla, Tesla still managed to deliver more than 340k vehicles in Q3.
But how should you interpret the Q3 earnings? What do they mean? Frankly…
What the hell is going on? What will happen to Tesla stock during these difficult times and how has Tesla positioned themselves to have a record-breaking Q4?
In this short article I talk break down the Tesla Q3 earnings through 7 easy and customizable charts that highlight Tesla’s unique positioning to crush their competition whilst being on pace to become one of the worlds biggest companies ever…..
Tesla’s Competition is Dying 🤯
Thankyou for opening your Tesla folder! 📂
Today we’re doing something different. After 8 months of not sending you any email updates, i have a good reason. In silence I have been building Finchart website ! https://finchart.co/
A website where you can see any companies most fundamental data visualized in intractive charts, custom to the company!
Why?
Because Better Data = Smarter Decisions
Today we’re going to walk through the Q3 earnings using my platform which you can access for free right now! We will be using the https://finchart.co/tsla page
Quick and important question to you! Do you wish to receive product updates, to receive Tesla earnings via email? To receive updates when we add new companies to the website ? (we’re adding Google, Amazon, Twitter, Facebook and GM this week!
Click on this image below to enter your email on a web-page that opens up!
(1) Net income - Going bonkers!
Tesla reported more than $3.30 Billion in Net income. That is a record number only just beating Q1. Tesla however guided towards deliveries of 400k+ next quarter meaning Net income is also likely to increase by $1-1.5 billion!
(2,3) Free Cash Flow - Money Machine?
Tesla is now reportedly making vehicles on average for only $30k per vehicle (remember, no marketing spend either!). Average selling prices for Tesla vehicles did decrease slightly but they’re still up year over year. This shows that there is enough demand for Tesla to raise prices such that they can absorb rising inflation.
You can see that Tesla’s Average Selling Price (ASP) is down QoQ from $56k to $53.5k per vehicle. ASP Is still up Year Over Year however.
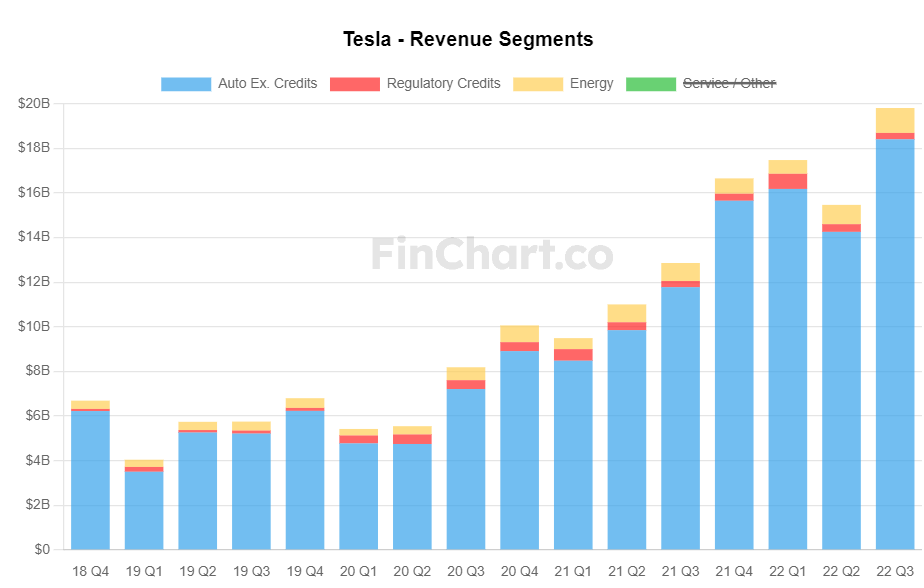
(4,5) What happened with revenue?
Tesla revenue grew a healthy 56%! Year over Year! Whilst in the mean time, the Operational Expenditure roseonly 2% YoY (see below) showing that Tesla is generating significant operating leverage and continually improving production to become more efficient.
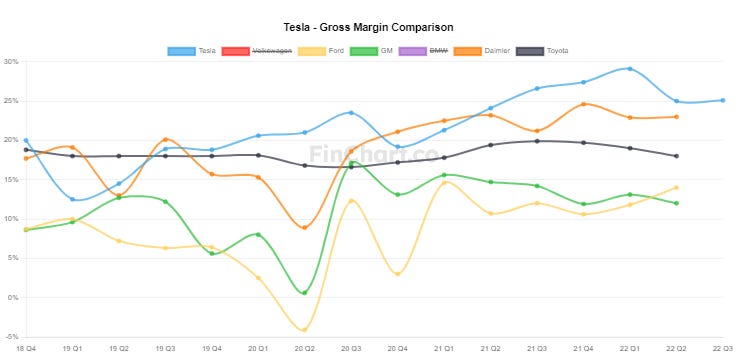
(6,7) But but… the competition?
The ‘competition’ is shipping vehicles without key security features, like Ford shipping vehicles without chips controlling non-safety critical features. Not only this, but Ford and other OEM’s are at the mercy of dealerships, Tesla doesn’t have this ridiculously outdated model and is achieving higher profit because of it. You know something else that competitors can’t say?
Why would anyone want a non-Tesla EV? Or even a non Tesla vehicle in general?
“If (you) care about having the latest technology, much lower cost of ownership than an ICE vehicle, little maintenance and best in class safety, then an EV is the way to go (specifically a Tesla). “ Respected Twitter analyst Sawyer Merritt said
And that isn’t even taking into account that Tesla’s tend to APPRECIATE after having bought them..
“Tesla’s hold their value better than almost any major auto makers vehicles.” said Merrit.
OK, so buying a Tesla and having the cars value go up is insane right. But it gets crazier.
Let me tell you something REALLY crazy.
These cars are increasing in profitability, Tesla is continually making more money on each vehicle they produce over time.
You can see the significant production advantage Tesla has compared to its ‘competition’ that is significantly lagging behind in the following comparison chart, courtsey of Finchart.co
Want proof? See for yourself :)
You can head over to FinChart and customize the charts yourself, we’re constantly adding new companies and features! It would be phenomenal to have your feedback!


You made it this far ? Wow, hey I guess follow me on Twitter here if you want :)


